|
|
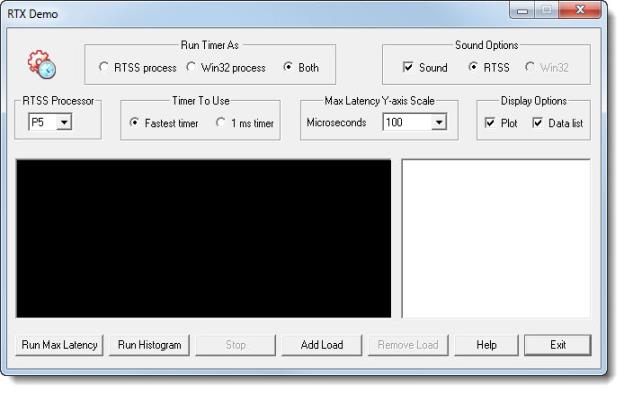
The RTX Demo graphically illustrates response time latencies in the Win32 and RTSS environments. It measures the total time to an RTSS or Windows program's timer handle (i.e., full thread context). It is a realistic measurement of latencies encountered by an application.
NOTE: Source code for the demo is provided in the samples directory.
The RTX Demo runs an RTSS timer process, a Win32 timer process, or both processes at the same time. It runs the process using either the fastest timer or a 1 ms timer. The timer can also be used to drive a sound speaker. The results are plotted to the graphical area where minimum, average, and maximum latency values are displayed. There are two types of plots: a plot showing the maximum latency values over time and a plot showing the raw data counts of maximum latency values for one sample period.
To run the RTX Demo:
| Option | Description |
|---|---|
|
Run Timer As |
Run an RTSS process, a Win32 process, or both processes at once. The default is an RTSS process. |
|
Sound Options |
Choose to hear sound or not. The default setting is sound enabled. If running both types of processes, you can choose from which process to hear sound. You can also change the sound options while the timer process is running. |
|
RTSS Processor |
Choose which processor to run the test on. |
|
Timer to Use |
Choose either the fastest timer available or the 1 ms timer. This option cannot be changed while the process is running. |
|
Display Options |
The Plot option displays graphs in the graphical output area. The default setting is plot enabled at the start of a run. The Data option writes latency values to the data area. The default setting is data enabled at the start of a run. You can change these options while the process is running. |
|
Max Latency Y-axis Scale |
This option is used with the Run Max Latency action only. The selectable values for the plot's y-axis scale are 100 ms, 1000 ms, and 10,000 ms. The default is 100 ms. You cannot change this selection during data retrieval. This option is disabled when running the histogram option. |
|
Run Max Latency |
Plots the maximum and average latency values at one-second intervals. RTSS process results are plotted in cyan, Win32 results in red. The minimum, average, and maximum latency values are recorded in the data area. |
|
Run Histogram |
Plots the number of latency values occurring within one-second intervals. RTSS process results are plotted in cyan, Win32 results in red. The minimum, average, and maximum values are recorded in the data area, along with the raw data for the histogram. |
|
Stop |
Stops the process. |
|
Add Load |
Simulates a disk load on the system in order to show more accurately the maximum latency times on a busy system. The load consists of creating a file and writing to it repeatedly with no buffering. |
|
Remove Load |
Stops the "load" process. |
|
Help |
Launches the RTX documentation. |
|
Exit |
Terminates the program. |
